Categories
Statistics
Since 08.08.2014
Counts only, if "DNT = disabled".
Your IP is 3.137.177.116
ec2-3-137-177-116.us-east-2.
Counts only, if "DNT = disabled".
Your IP is 3.137.177.116
ec2-3-137-177-116.us-east-2.
Info
เราจะทำแบบวิศวกรผู้ยิ่งใหญ่
25. December 2024
YOU RATED THIS ...
avg = 0.0 , n = 0


PyLab-Amplitude-Response-107.php 10926 Bytes 16-10-2024 08:22:36
Python Lab Experiments - 10.7 MHz Bandpass
Arduino Lab Automation Example / Exercise

✈ Minimum Equipment List (MEL)
| DEVICES | REMARKS |
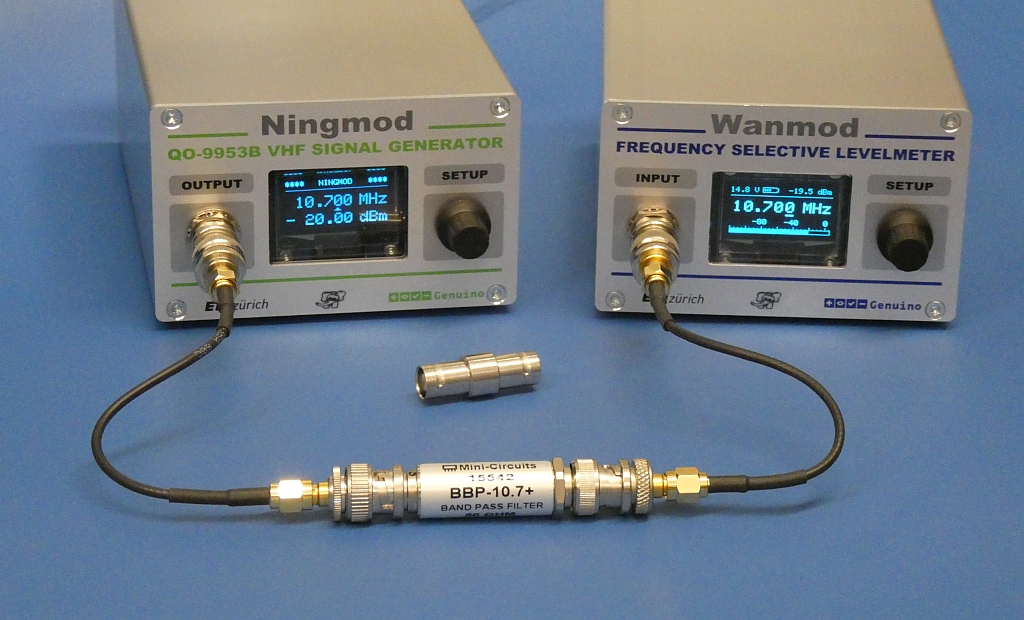
| Synthesizer | Frequency Source, e.g. Ningmod |
| Levelmeter | measures Power in dBm, e.g. Wanmod |
| D.U.T. | Anything with an interesting Amplitude Response |
We used only Arduino™ based devices here, as this simplifies the Python Script.
(PyVISA is covered in a later exercise).
✈ Goal • learning content
• Control multiple devices in a loop
• Plot graphs
• Plot graphs
🐍 The Python Script
# -*- coding: utf-8 -*-
"""
Created on Tue Aug 17 11:28:15 2022

Simple Sketch to Sweep Ningmod from F1 to F2
This one also sweeps the Receiver Wanmod and graphs the RSSI

@author: Changpuak

"""

import serial
import time
import matplotlib.pyplot as plt
import numpy as np


# PLEASE DON'T FORGET TO CHANGE THE NUMBER OF THE COM PORT
Ning = serial.Serial(port='COM89', baudrate=115200, timeout=.9)
Wan = serial.Serial(port='COM66', baudrate=115200, timeout=.9)

time.sleep(5)           # Arduinos reset, wait to start up

FREQ_CENTER = 10.7      # MHz
FREQ_SPAN  = 2.0        # MHz
FREQ_POINTS = 100
FREQ_START = FREQ_CENTER - (FREQ_SPAN / 2)
FREQ_STOP  = FREQ_CENTER + (FREQ_SPAN / 2)
FREQ_DELTA = FREQ_SPAN / FREQ_POINTS


WAIT = 1                # seconds

FREQ = FREQ_START

x = []
y = []
f = []  # Frequency
l = []  # Level


def CHAT_NINGMOD(x):
    Ning.write(x.encode('utf-8'))
    time.sleep(0.5)
    data = []
    line = (Ning.readline())
    while len(line) > 0:
        data.append(line)
        line = Ning.readline()
        line = line.decode('utf-8')
    return data


def CHAT_WANMOD(x):
    Wan.write(x.encode('utf-8'))
    time.sleep(0.5)
    data = []
    line = (Wan.readline())
    while len(line) > 0:
        data.append(line)
        line = Wan.readline()
        line = line.decode('utf-8')
    return data


def EMPTY_NINGMOD(x):
    time.sleep(1)
    x = b'avanti'
    while x != b'':
        x = Ning.readline()
        # print(x)


def EMPTY_WANMOD(x):
    time.sleep(1)
    x = b'avanti'
    while x != b'':
        x = Wan.readline()
        # print(x)


try:
    print("STARTING SWEEP ...")
    # SET LEVEL SOURCE
    CHAT_NINGMOD('SETA:-20\n')  # REMAINS CONSTANT
    EMPTY_NINGMOD(x)
    while FREQ <= FREQ_STOP:
        f.append(FREQ*1000)                        # FILL ARRAY
        # SET FREQUENCY SOURCE
        CHAT_NINGMOD('SETF:'+str(FREQ)+'\n')
        EMPTY_NINGMOD(x)
        # SET FREQUENCY SINK
        CHAT_WANMOD('SETF:'+str(FREQ)+'\n')
        EMPTY_WANMOD(x)
        print("{:.4f}".format(FREQ)+" MHz")
        time.sleep(WAIT)
        # READ LEVEL SINK
        Level = str(CHAT_WANMOD('POW?\n'))
        Level = float(Level[3:-9])
        print(Level)
        l.append(Level)                            # FILL ARRAY
        FREQ += FREQ_DELTA
        #
        plt.style.use('bmh')
        # plot
        fig, ax = plt.subplots()
        ax.plot(f, l, linewidth=2.0)
        ax.set(xlim=(FREQ_START*1000, FREQ_STOP*1000),
			xticks=np.arange(FREQ_START*1000, FREQ_STOP*1000, FREQ_SPAN*100),
            ylim=(-100, -10), yticks=np.arange(-100, -10, 10))
        plt.show()
        # TO PAY ATTENTION TO : np.arrange is NOT for float -> CONVERT TO kHz

finally:
    Ning.close()
    Wan.close()
    print("CONNECTIONS CLOSED.")
✈ The Results : various Filters, Attenuators, ...
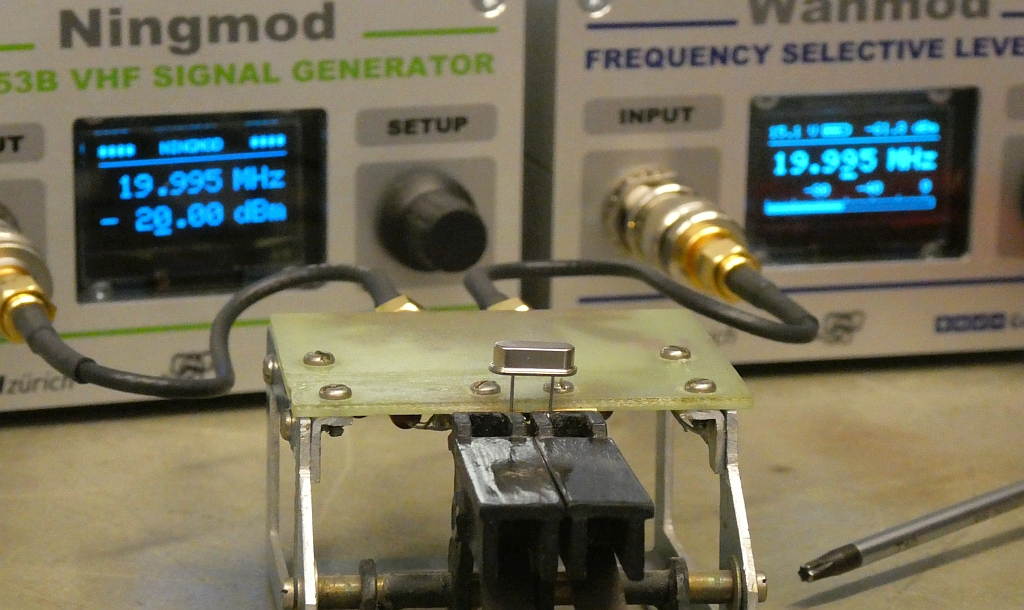
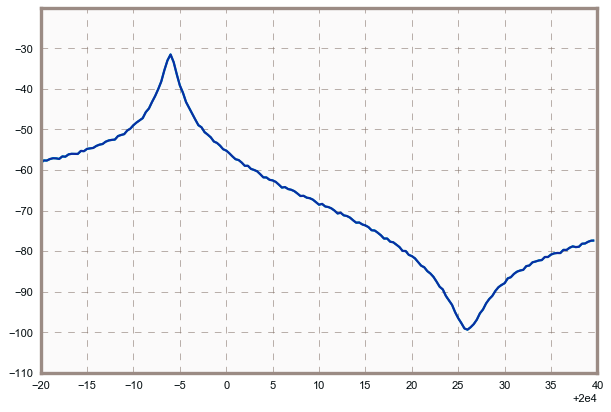
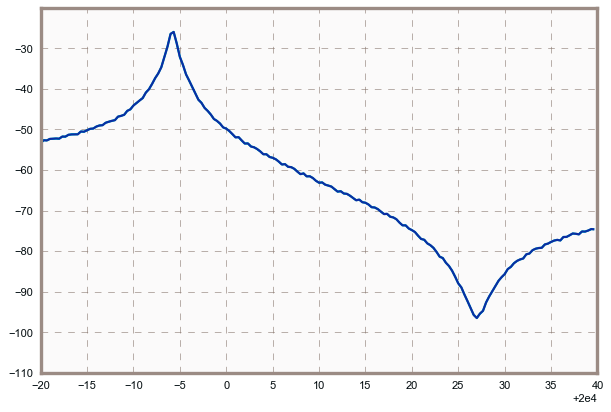
Above : Crystal Test Fixture.
Below : Frequency Response of Quartz Crystals. Clearly visisble is Fs an Fp.
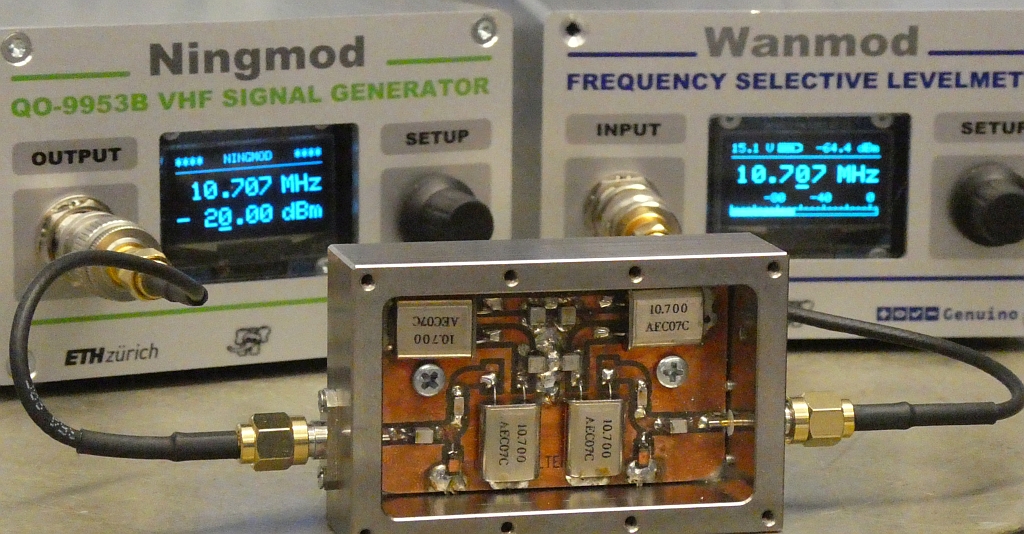
Above : DIY Crystal Bandpass
Below : Frequency Response of that 10.7 MHz Thing (left)
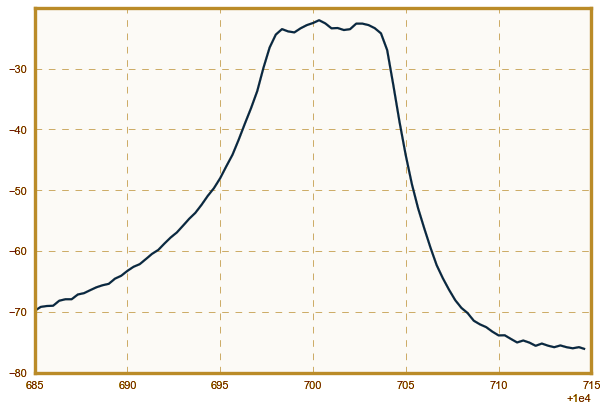
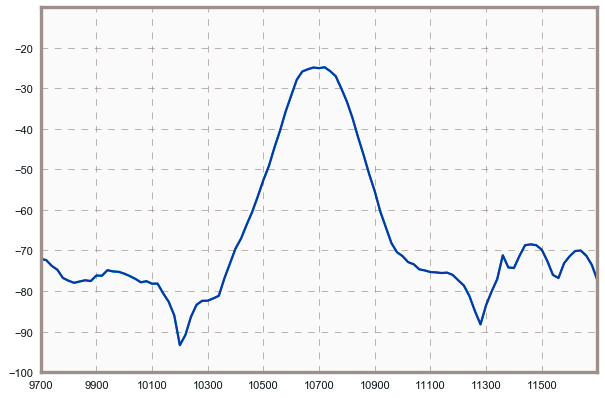
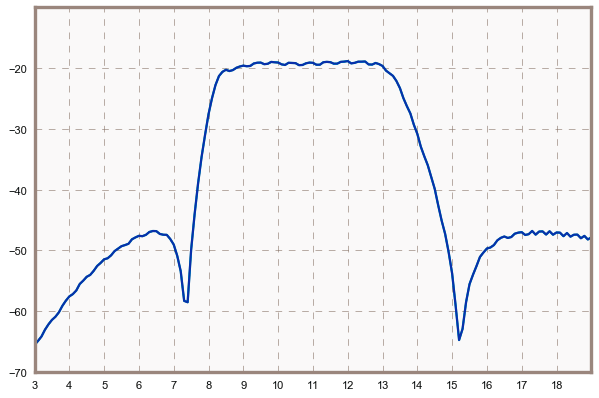
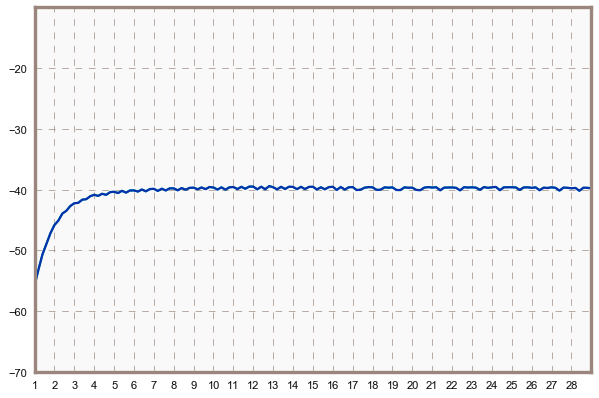
If not mentionned, Power was always - 20 dBm
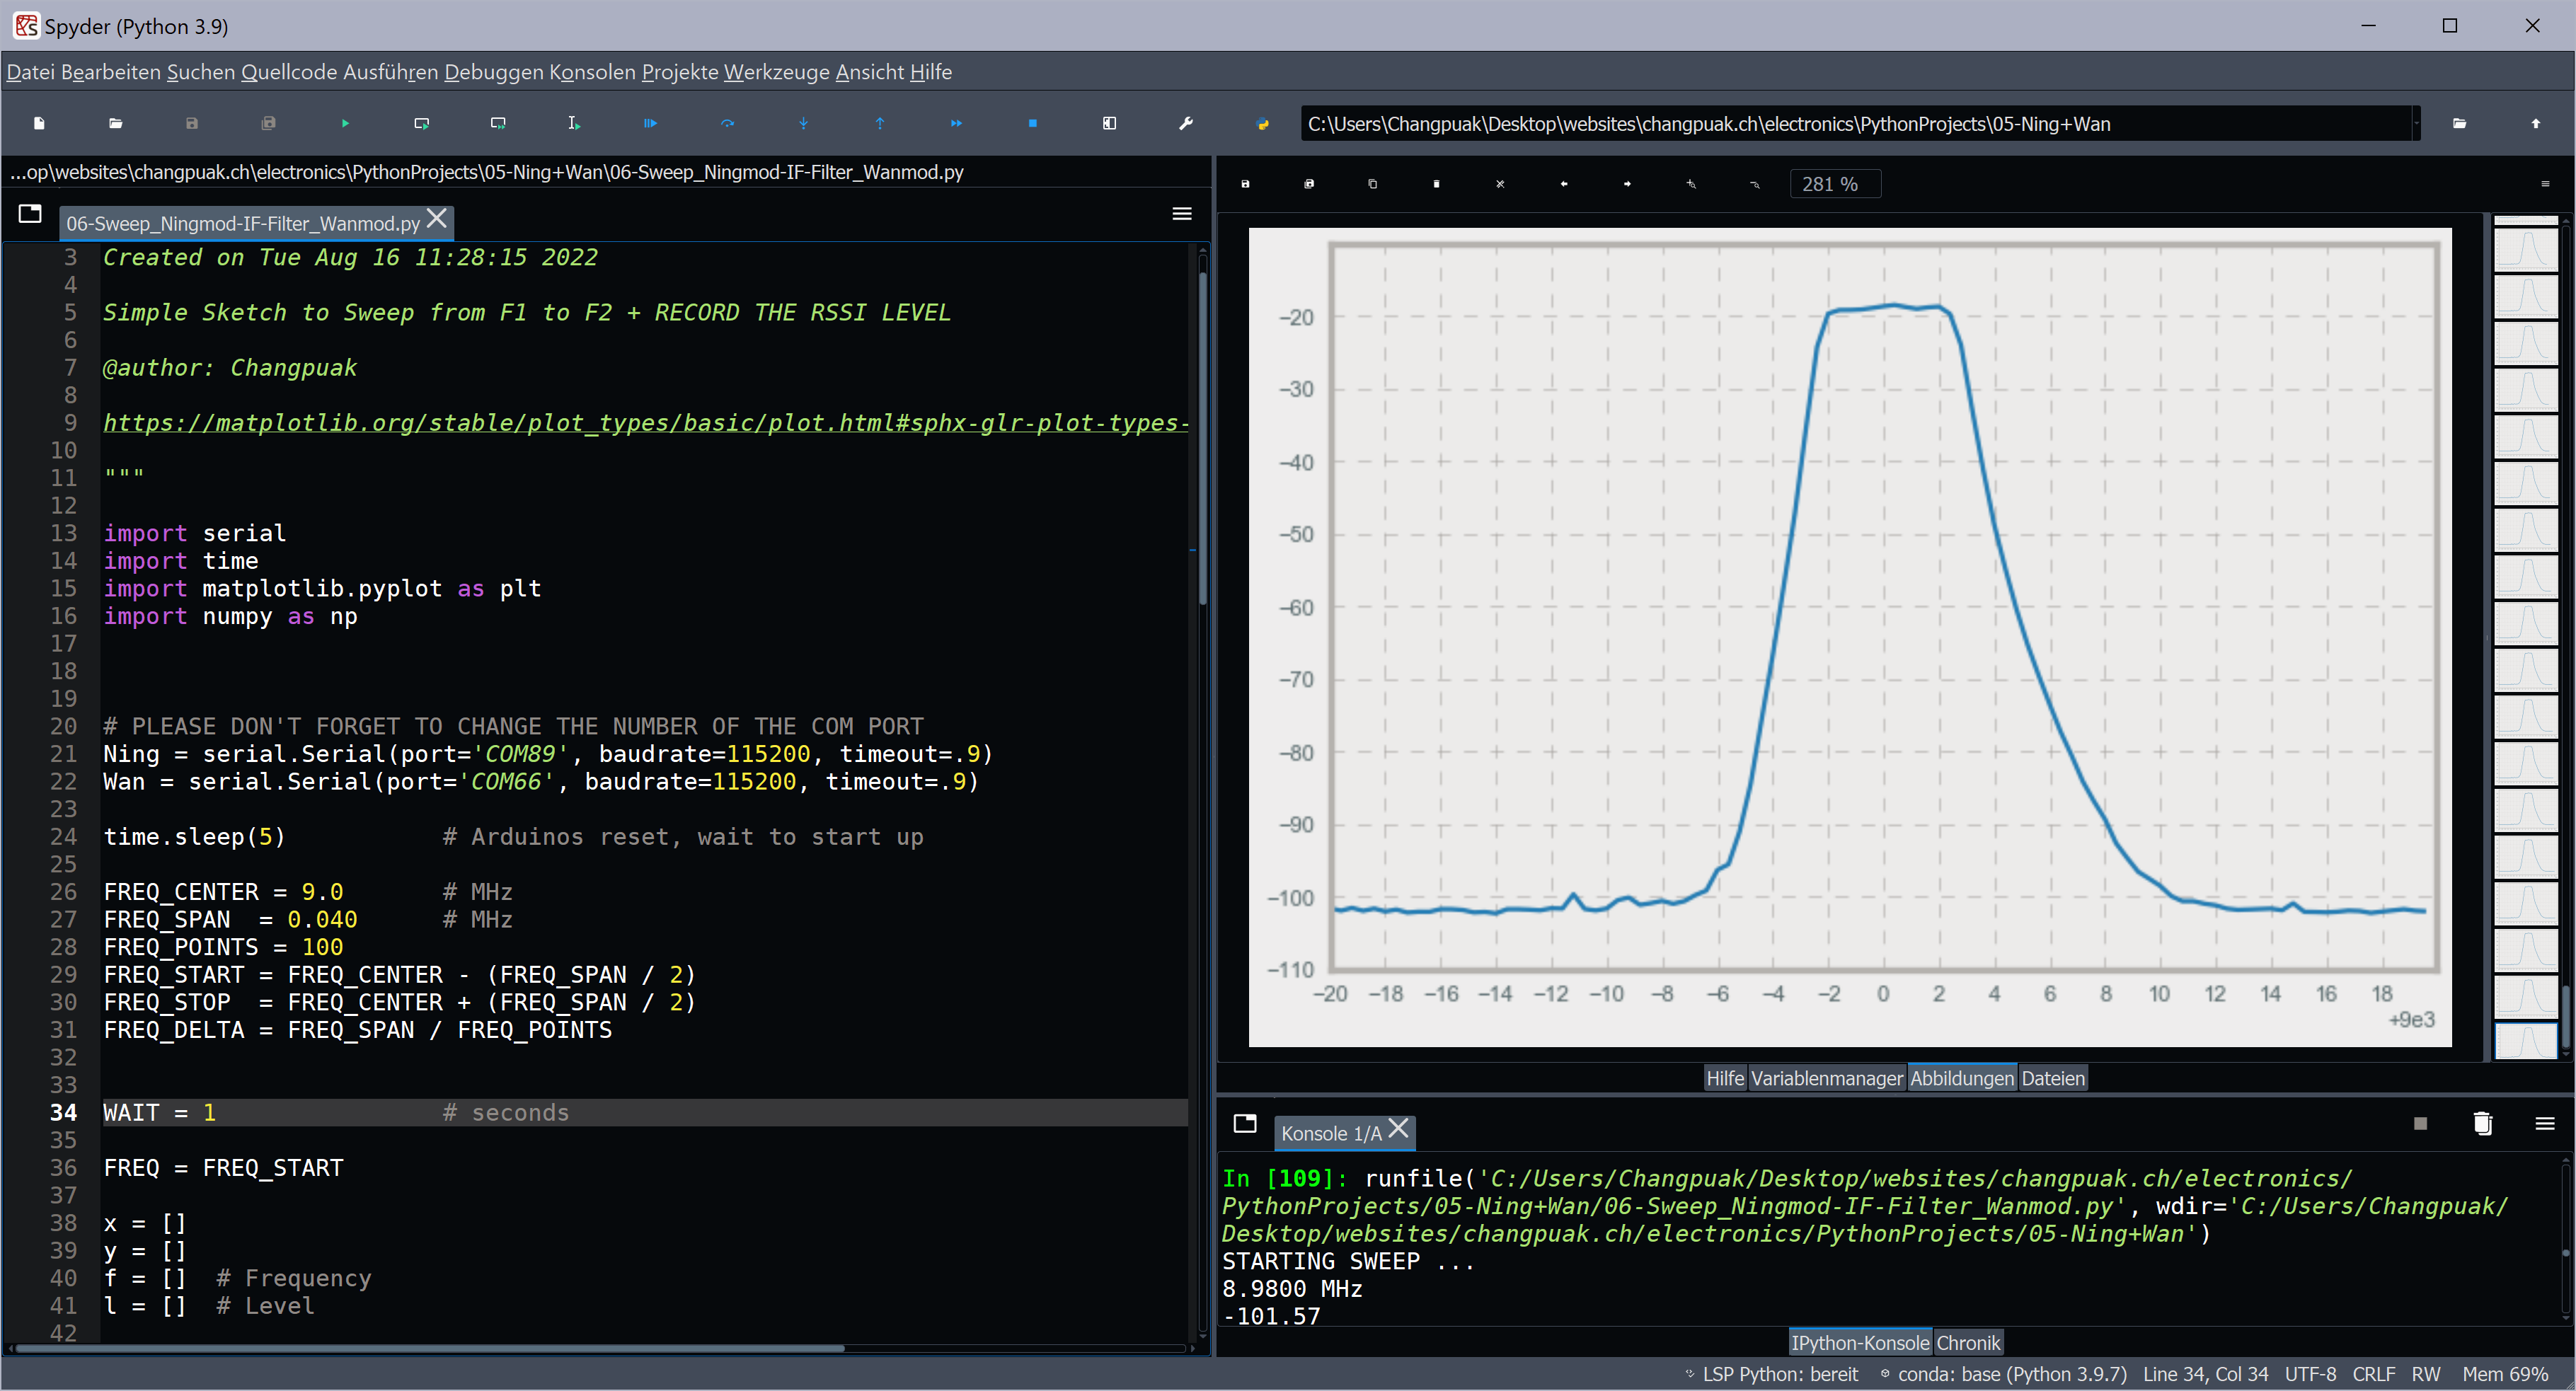
The Spyder Environment, while Sweeping ...
✈ Share your thoughts
The webmaster does not read these comments regularely. Urgent questions should be send via email.
Ads or links to completely uncorrelated things will be removed.
Your Browser says that you allow tracking. Mayst we suggest that you check that DNT thing ?
 ช้างเผือก
